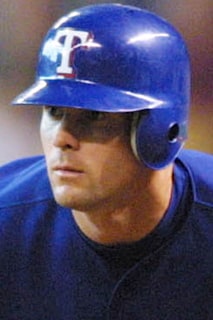
Michael Young
Born: 10/19/1976 in Covina, CA, USA
MLB Debut: 2000-09-29 | Final Game: 2013-09-29
Bats: R | Throws: R | Height: 6'1" | Weight: 200 lbs
Full name: Michael Brian Young
Biography
Michael Young, born in 1976, was a distinguished Major League Baseball player whose career spanned from 2000 to 2013. Known for his versatility and consistency, Young played in 1,970 games, amassing a remarkable 2,375 hits and finishing with a career batting average of .300. He demonstrated a balanced offensive skill set, hitting 185 home runs and driving in 1,030 runs throughout his career. Additionally, he showcased his speed on the base paths with 90 stolen bases, further solidifying his reputation as a well-rounded player.
Young was a seven-time All-Star, earning accolades for his performances in multiple seasons, including an All-Star Game MVP award. His ability to perform under pressure and adapt to various positions on the field made him a valuable asset to his teams, particularly during his time with the Texas Rangers. As a key figure in the game during the early 2000s, Young contributed to the evolution of the shortstop position, blending traditional defensive skills with an offensive approach that helped redefine the role for future generations. His legacy in baseball remains significant, as he was a model of consistency and excellence throughout his career.
Career Batting Statistics
| G | AB | R | H | 2B | 3B | HR | RBI | SB | BB | SO | AVG | OBP | SLG | OPS | PIV |
|---|---|---|---|---|---|---|---|---|---|---|---|---|---|---|---|
| 1970 | 7918 | 1137 | 2375 | 441 | 60 | 185 | 1030 | 90 | 575 | 1235 | 0.300 | 0.346 | 0.441 | 0.787 | 8535.1 |
Season-by-Season Batting
| Year | Team | Lg | G | AB | R | H | 2B | 3B | HR | RBI | SB | BB | SO | AVG | PIV |
|---|---|---|---|---|---|---|---|---|---|---|---|---|---|---|---|
| 2000 | TEX | AL | 2 | 2 | 0 | 0 | 0 | 0 | 0 | 0 | 0 | 0 | 1 | 0.000 | 0.0 |
| 2001 | TEX | AL | 106 | 386 | 57 | 96 | 18 | 4 | 11 | 49 | 3 | 26 | 91 | 0.249 | -704.1 |
| 2002 | TEX | AL | 156 | 573 | 77 | 150 | 26 | 8 | 9 | 62 | 6 | 41 | 112 | 0.262 | -1061.9 |
| 2003 | TEX | AL | 160 | 666 | 106 | 204 | 33 | 9 | 14 | 72 | 13 | 36 | 103 | 0.306 | 409.1 |
| 2004 | TEX | AL | 160 | 690 | 114 | 216 | 33 | 9 | 22 | 99 | 12 | 44 | 89 | 0.313 | 1296.3 |
| 2005 | TEX | AL | 159 | 668 | 114 | 221 | 40 | 5 | 24 | 91 | 5 | 58 | 91 | 0.331 | 2858.5 |
| 2006 | TEX | AL | 162 | 691 | 93 | 217 | 52 | 3 | 14 | 103 | 7 | 48 | 96 | 0.314 | 801.8 |
| 2007 | TEX | AL | 156 | 639 | 80 | 201 | 37 | 1 | 9 | 94 | 13 | 47 | 107 | 0.315 | 577.3 |
| 2008 | TEX | AL | 155 | 645 | 102 | 183 | 36 | 2 | 12 | 82 | 10 | 55 | 109 | 0.284 | -157.7 |
| 2009 | TEX | AL | 135 | 541 | 76 | 174 | 36 | 2 | 22 | 68 | 8 | 47 | 90 | 0.322 | 2043.3 |
| 2010 | TEX | AL | 157 | 656 | 99 | 186 | 36 | 3 | 21 | 91 | 4 | 50 | 115 | 0.284 | 664.5 |
| 2011 | TEX | AL | 159 | 631 | 88 | 213 | 41 | 6 | 11 | 106 | 6 | 47 | 78 | 0.338 | 2361.5 |
| 2012 | TEX | AL | 156 | 611 | 79 | 169 | 27 | 3 | 8 | 67 | 2 | 33 | 70 | 0.277 | -791.8 |
| 2013 | LAD | NL | 21 | 51 | 3 | 16 | 2 | 1 | 0 | 4 | 0 | 1 | 5 | 0.314 | -20.3 |
| 2013 | PHI | NL | 126 | 468 | 49 | 129 | 24 | 4 | 8 | 42 | 1 | 42 | 78 | 0.276 | -20.3 |
Postseason Statistics
Playoff Career Batting
| G | AB | R | H | 2B | 3B | HR | RBI | BB | SO | AVG |
|---|---|---|---|---|---|---|---|---|---|---|
| 43 | 151 | 11 | 36 | 10 | 0 | 3 | 19 | 5 | 31 | 0.238 |
Playoff Batting by Year
| Year | Round | Team | G | AB | R | H | 2B | 3B | HR | RBI | BB | SO | AVG |
|---|---|---|---|---|---|---|---|---|---|---|---|---|---|
| 2013 | NLDS2 | LAN | 3 | 3 | 0 | 1 | 0 | 0 | 0 | 0 | 0 | 1 | 0.333 |
| 2013 | NLCS | LAN | 6 | 7 | 0 | 0 | 0 | 0 | 0 | 0 | 0 | 0 | 0.000 |
| 2012 | ALWC | TEX | 1 | 4 | 0 | 2 | 0 | 0 | 0 | 0 | 0 | 0 | 0.500 |
| 2011 | WS | TEX | 7 | 27 | 3 | 7 | 4 | 0 | 1 | 5 | 1 | 7 | 0.259 |
| 2011 | ALCS | TEX | 6 | 28 | 3 | 7 | 3 | 0 | 1 | 7 | 1 | 6 | 0.250 |
| 2011 | ALDS2 | TEX | 4 | 15 | 1 | 2 | 0 | 0 | 0 | 0 | 1 | 2 | 0.133 |
| 2010 | ALDS1 | TEX | 5 | 20 | 1 | 3 | 0 | 0 | 1 | 3 | 0 | 6 | 0.150 |
| 2010 | ALCS | TEX | 6 | 27 | 3 | 9 | 3 | 0 | 0 | 4 | 1 | 7 | 0.333 |
| 2010 | WS | TEX | 5 | 20 | 0 | 5 | 0 | 0 | 0 | 0 | 1 | 2 | 0.250 |
Fielding Statistics
Career Fielding Totals by Position
| Position | G | GS | PO | A | E | DP |
|---|---|---|---|---|---|---|
| 1B | 111 | 98 | 829 | 47 | 5 | 92 |
| 2B | 448 | 433 | 867 | 1239 | 29 | 312 |
| 3B | 465 | 457 | 273 | 755 | 45 | 80 |
| SS | 793 | 777 | 1121 | 2278 | 81 | 530 |
Season-by-Season Fielding
| Year | Team | Pos | G | GS | PO | A | E | DP |
|---|---|---|---|---|---|---|---|---|
| 2000 | TEX | 2B | 1 | 0 | 0 | 0 | 0 | 0 |
| 2001 | TEX | 2B | 104 | 102 | 212 | 284 | 8 | 79 |
| 2002 | TEX | 2B | 152 | 144 | 298 | 420 | 9 | 97 |
| 2002 | TEX | 3B | 4 | 0 | 0 | 3 | 0 | 0 |
| 2002 | TEX | SS | 11 | 1 | 2 | 10 | 0 | 2 |
| 2003 | TEX | 2B | 159 | 158 | 305 | 471 | 10 | 117 |
| 2003 | TEX | SS | 7 | 1 | 4 | 5 | 0 | 1 |
| 2004 | TEX | SS | 158 | 158 | 225 | 423 | 19 | 98 |
| 2005 | TEX | SS | 155 | 155 | 238 | 427 | 18 | 95 |
| 2006 | TEX | SS | 155 | 155 | 241 | 492 | 14 | 113 |
| 2007 | TEX | SS | 150 | 150 | 211 | 446 | 19 | 107 |
| 2008 | TEX | SS | 151 | 151 | 193 | 465 | 11 | 113 |
| 2009 | TEX | 3B | 134 | 134 | 72 | 208 | 9 | 29 |
| 2010 | TEX | 3B | 155 | 155 | 95 | 265 | 19 | 26 |
| 2011 | TEX | 1B | 36 | 36 | 267 | 13 | 3 | 34 |
| 2011 | TEX | 2B | 14 | 14 | 28 | 29 | 0 | 11 |
| 2011 | TEX | 3B | 40 | 39 | 30 | 66 | 5 | 9 |
| 2011 | TEX | SS | 1 | 1 | 1 | 2 | 0 | 1 |
| 2012 | TEX | 1B | 41 | 40 | 358 | 24 | 2 | 37 |
| 2012 | TEX | 2B | 16 | 14 | 24 | 31 | 2 | 8 |
| 2012 | TEX | 3B | 25 | 25 | 18 | 38 | 2 | 3 |
| 2012 | TEX | SS | 4 | 4 | 6 | 6 | 0 | 0 |
| 2013 | LAN | 1B | 8 | 3 | 28 | 2 | 0 | 4 |
| 2013 | LAN | 2B | 2 | 1 | 0 | 4 | 0 | 0 |
| 2013 | LAN | 3B | 8 | 5 | 0 | 9 | 1 | 1 |
| 2013 | LAN | SS | 1 | 1 | 0 | 2 | 0 | 0 |
| 2013 | PHI | 1B | 26 | 19 | 176 | 8 | 0 | 17 |
| 2013 | PHI | 3B | 99 | 99 | 58 | 166 | 9 | 12 |
Career Games by Position
| Position | Games |
|---|---|
| First Base | 111 |
| Second Base | 448 |
| Third Base | 465 |
| Shortstop | 793 |
| Designated Hitter | 167 |
Awards & Honors
| Year | Award | Notes |
|---|---|---|
| 2011 | MLB Players Choice Man of the Year | |
| 2011 | Player of the Week | Week of 2011-06-26 |
| 2009 | Player of the Week | Week of 2009-08-23 |
| 2008 | Gold Glove | SS |
| 2008 | MLB Players Choice Man of the Year | |
| 2006 | All-Star Game MVP | |
| 2005 | TSN All-Star | SS |
| 2002 | Player of the Week | Week of 2002-06-15 |
Salary History
| Year | Team | League | Salary |
|---|---|---|---|
| 2013 | PHI | NL | $18,374,975 |
| 2012 | TEX | AL | $16,174,974 |
| 2011 | TEX | AL | $16,174,974 |
| 2010 | TEX | AL | $13,174,974 |
| 2009 | TEX | AL | $13,054,526 |
| 2008 | TEX | AL | $6,174,974 |
| 2007 | TEX | AL | $3,575,000 |
| 2006 | TEX | AL | $3,075,000 |
| 2005 | TEX | AL | $2,575,000 |
| 2004 | TEX | AL | $450,000 |
| 2003 | TEX | AL | $415,000 |
| 2002 | TEX | AL | $250,000 |
| Total Career Earnings | $93,469,397 | ||
College History
| School Name | City | State | Years Attended |
|---|---|---|---|
| University of California - Santa Barbara | Santa Barbara | CA | 1994, 1995, 1996, 1997 |
Award Voting History
| Year | Award | League | Finish | Points Won | Points Max | Votes First |
|---|---|---|---|---|---|---|
| 2011 | Most Valuable Player | AL | 8th | 96.0 | 392 | 1 |
| 2009 | Most Valuable Player | AL | 16th | 13.0 | 392 | 0 |
| 2006 | Most Valuable Player | AL | 30th | 1.0 | 392 | 0 |
| 2005 | Most Valuable Player | AL | 11th | 20.0 | 392 | 0 |
| 2004 | Most Valuable Player | AL | 8th | 92.0 | 392 | 0 |